Schematic Diagram vs Single Line Diagram (SLD): Differences, Standards, and Why You Need Both
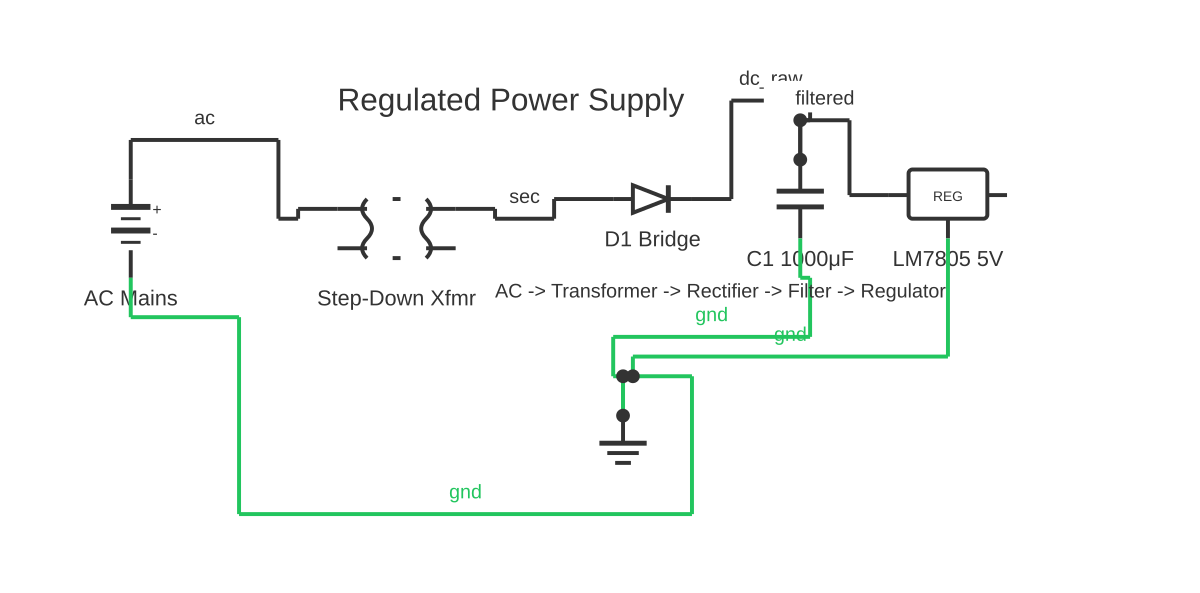
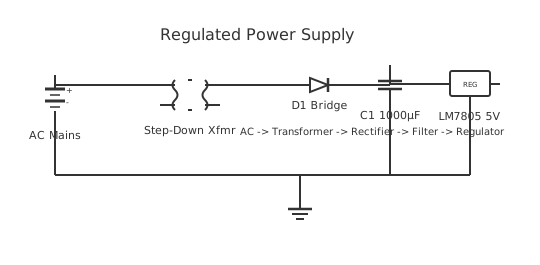
This is a free printable schematic diagram vs single line diagram: download the diagram as SVG or open it and print to paper or PDF.
A single-line diagram (SLD), also called a one-line diagram, represents a three-phase power system by condensing all three phase conductors into a single line, showing only major power equipment — generators, transformers, buses, circuit breakers, disconnects, current transformers, and potential transformers. A schematic diagram (also called an elementary or relay logic diagram in this context) shows the low-voltage control circuit logic — relay coils, contacts, fuses, pilot lights, timers, and control transformers — that governs how that power equipment is switched and protected. The two documents operate at different levels of the power-to-control hierarchy and are both mandatory for any professionally documented electrical power or industrial project.
The power-to-control hierarchy is the conceptual framework that makes sense of electrical documentation on complex power and industrial projects. At the top sits the single-line diagram: it provides a bird's-eye view of the entire power distribution system, from the utility service entrance or generator output, through transformers and switchgear, to the final motor or load connections. Below it sits the schematic diagram: it shows the relay logic, control transformer wiring, and interlocking circuits that operate the breakers and contactors depicted on the SLD. Below the schematic sits the wiring diagram: it provides the physical terminal-by-terminal installation detail for the control panels. These three levels — SLD, schematic, wiring diagram — constitute the core documentation package for any medium-voltage industrial or commercial electrical project, and understanding what belongs at each level prevents both over-documentation and dangerous under-documentation.
A single-line diagram condenses three-phase power into a single line because power engineers are primarily interested in the system topology — which buses are connected, which breakers can isolate which sections, what impedances transformers present — not in the identical behaviour of each of the three phases. This simplification is meaningful and internationally standardised. In a balanced three-phase system, all three phases carry the same current magnitude and differ only in phase angle. Showing all three lines would triple the drawing complexity with no additional engineering information. The SLD captures: generation (utility tie or in-plant generator), step-down transformers with kVA rating and winding configuration (delta-wye, wye-wye), primary and secondary voltage levels, bus bars with voltage ratings, main and feeder circuit breakers with trip ratings, disconnect switches, motor feeders with cable ampacity, current transformers (CTs) for protective relay sensing, and potential transformers (PTs) for voltage measurement and metering.
The IEEE definition and governing standards for single-line diagrams are found in IEEE 141 (the Red Book), the authoritative guide to electric power distribution for industrial plants. IEEE 315 and ANSI Y32.9 define the graphical symbols used on SLDs — the square for a circuit breaker, the diagonal line for a disconnect, the symbol for a CT or PT, the bus bar representation. IEC 60617 Part 11 covers power system symbols for international projects. In North America, NFPA 70 (the National Electrical Code) requires that a single-line diagram of the service entrance be available for facilities above a certain size and complexity — specifically, NEC 230 and 240 mandate the availability of documentation that shows the service entrance configuration, main disconnect, and feeder arrangements. Without an accurate SLD on file, a facility cannot be safely maintained or efficiently expanded.
Arc flash hazard analysis, mandated by NFPA 70E for any facility where qualified workers may be exposed to electrical hazards, depends entirely on the accuracy of the single-line diagram. The IEEE 1584 arc flash calculation methodology requires the SLD as its primary input: the calculation needs to know the short-circuit current available at each bus (derived from transformer impedances and upstream source impedance visible on the SLD), the arcing fault current at each point, and the protective device clearing time (from the device trip curves, which are coordinated using the SLD to identify the protecting device). If the SLD is inaccurate or out of date, the arc flash labels on electrical panels will be wrong, potentially exposing workers to energy levels that exceed the protection rating of their PPE. This is a life-safety issue, and it is entirely absent from the competitor pages on this topic.
Protective relay coordination studies use the SLD to model the entire protection hierarchy. The coordination engineer reads the SLD to identify every protective device in series between the load and the source, then plots the time-current characteristics of each device on a log-log coordination curve (a time-current curve, or TCC) to verify that the device closest to a fault clears before the upstream device trips, maintaining selectivity. This 'relay coordination' work — performed by specialist protection engineers using tools such as ETAP or SKM PowerTools — is only possible because the SLD makes the complete topology of the power system visible on a single drawing. The schematic diagram plays a supporting role here: the schematic shows the secondary circuits of CTs and PTs feeding the relay input terminals, the relay contact outputs that trip breakers, and the control power circuits that power the relays — details that the SLD does not show.
Schematic diagrams in the power and industrial context are quite different from electronic PCB schematics. In industrial and power applications, schematics are typically drawn in ladder diagram format: two vertical power rails (L1 and N, or 120 V phase and neutral) with horizontal rungs, each rung containing the contacts and coil or output element for a single logical function. The symbols are defined by IEC 60617 Parts 2–13: the normally open (NO) contact is two short parallel lines with a gap; the normally closed (NC) contact is the same with a diagonal line through the gap; the relay coil is a circle or rectangle (depending on regional standard). NFPA 79 and JIC (Joint Industrial Council) standards govern schematic drafting for industrial machinery in North America.
The power-to-control relationship in a typical industrial motor control centre (MCC) illustrates how the two document types complement each other. The SLD shows the MCC as a bus section with feeder circuit breakers to individual motor starter cubicles, each labelled with motor HP, voltage, and feeder cable size. It shows the utility transformer upstream and the metering CTs on the bus. The schematic for the same installation shows the individual motor starter cubicle in detail: the 480 V main contactor (shown as a schematic symbol, not a box), the 120 V control circuit supplied by the control transformer, the stop/start pushbutton circuit (normally closed stop contact in series with normally open start contact, in series with the motor contactor coil and a sealing contact), the overload relay contact in the stop circuit, the pilot light indicating run status, and the control power fuse. An installer wiring the cubicle works from the wiring diagram. A commissioning engineer troubleshooting a motor that won't start works from the schematic. A protection engineer modifying the upstream feeder protection works from the SLD.
Data centre power systems are a modern SLD-intensive application that competitors completely ignore. Every data centre has an SLD documenting the path from utility service entrance through medium-voltage switchgear, step-down transformers, automatic transfer switches (ATS), power distribution units (PDUs), and UPS systems to the server rack power strips. The SLD is used by the facilities team to plan maintenance outages ('which breakers must be open to isolate PDU-A without affecting PDU-B?'), to verify N+1 or 2N redundancy configurations, and to perform load flow analysis to ensure no feeder is overloaded. The detailed relay logic for transfer switch operation and UPS bypass is then in the schematic.
Software tools for SLDs differ from schematic tools. ETAP and SKM PowerTools are specialist power system analysis programs that use the SLD as their data model for load flow, short-circuit, and arc flash calculations — not just drawing tools. AutoCAD Electrical produces both SLDs and schematics but does not perform power system analysis. For professionals who need only to document a small distribution system or industrial panel, circuitdiagrammaker.com provides SLD symbols (IEEE and IEC bus bars, circuit breakers, disconnects, transformers) as well as full schematic symbol libraries, accessible free in the browser.
One-line diagram is the US synonym for single-line diagram; both terms refer to the identical document type. The SLD and one-line terms are used interchangeably in IEEE publications, NFPA codes, and industry practice. International projects increasingly use 'single-line diagram' or 'SLD' to align with IEC terminology.
Need to draw a single-line diagram for your next arc flash study or a relay logic schematic for a new control panel? Our free online editor includes SLD symbols (IEEE and IEC), bus bars, circuit breakers, and full schematic symbol libraries — open it now, no download required.
How to wire schematic diagram vs single line diagram
- Establish the scope and voltage levels of the power system Identify the utility service voltage, all transformation stages, the lowest distribution voltage, and the boundary of your documentation scope. This determines what goes on the SLD vs what belongs on schematics.
- Draw the SLD from source to load Starting at the utility service entrance or generator, draw buses as horizontal lines, step-down transformers between voltage levels, main circuit breakers and their trip ratings, and feeder circuits to each load group. Annotate each element with its equipment tag (T1, CB1), rating (500 kVA, 800 A), and voltage level. Show CT and PT locations for metering and protection.
- Assign equipment tags and cross-references Every device on the SLD must have a unique tag (CB-101, XFMR-1) that appears consistently on the schematic, wiring diagram, and equipment schedule. This cross-referencing is what allows a commissioning engineer to move between documentation levels without losing track of which physical device is being discussed.
- Create schematics for each control circuit For each circuit breaker, contactor, or motor shown on the SLD, draw a ladder-format schematic showing the control circuit: control transformer, fusing, pushbuttons or DCS outputs, relay coils and contacts, interlocks, and indicator lights. Reference each device on the schematic back to its SLD equipment tag.
- Perform arc flash study using the SLD Input the SLD data — transformer impedances, cable lengths and sizes, protective device types and settings — into an arc flash calculation tool (ETAP, SKM, or IEEE 1584 spreadsheet). Calculate incident energy at each bus. Apply the resulting arc flash labels to the physical equipment and update the SLD with hazard boundary notes.
- Verify relay coordination across the SLD hierarchy Plot time-current curves for every overcurrent protective device shown on the SLD, from the smallest downstream fuse to the largest upstream circuit breaker. Verify that clearing times are selective — the device closest to any fault clears first. Adjust trip settings on adjustable devices and document the final settings on the SLD and in the relay setting sheets.
- Keep all three document levels synchronised Any change to the physical power system — new feeder, transformer replacement, breaker rating change — must update the SLD first, then the affected schematics, then the wiring diagrams. Issue all three under the same revision letter and require sign-off by the responsible power engineer before field implementation.
Specifications
| Primary purpose | SLD: show power system topology and major equipment | Schematic: show control circuit logic and device operating sequences |
|---|---|
| Phase representation | SLD: all three phases of a three-phase system condensed to a single line | Schematic: full multi-wire representation of control circuits (typically single-phase 120 V or 24 V) |
| Voltage levels | SLD: high voltage (transmission/distribution) down to LV distribution — covers the full power hierarchy | Schematic: low-voltage control circuits (24 V DC, 120 V AC, 240 V AC control power) |
| Equipment shown | SLD: generators, transformers, buses, circuit breakers, disconnects, CTs, PTs, capacitor banks, load labels | Schematic: relay coils, contacts (NO/NC), fuses, pilot lights, timers, control transformers, pushbuttons |
| Used for | SLD: arc flash studies, short-circuit analysis, load flow, relay coordination, NEC compliance documentation | Schematic: troubleshooting control faults, commissioning, control logic verification, UL/CE panel documentation |
| Governing standards | SLD: IEEE 141 (Red Book), IEEE 315, ANSI Y32.9, IEC 60617, NFPA 70 (NEC) | Schematic: IEC 60617, NFPA 79, JIC, NFPA 70E |
| Primary audience | SLD: power engineers, utility engineers, arc flash analysts, facility managers | Schematic: controls engineers, panel builders, field commissioning technicians |
| NFPA 70 code requirement | SLD: yes — required for service entrance documentation under NEC 230/240 | Schematic: not required by NEC, but mandatory for UL-listed control panels and CE-marked machinery |
| Position in documentation hierarchy | SLD: highest level — system topology overview | Schematic: middle level — control/functional detail |
| Software tools | SLD: ETAP, SKM PowerTools, AutoCAD Electrical, circuitdiagrammaker.com | Schematic: EPLAN Electric P8, AutoCAD Electrical, SEE Electrical, circuitdiagrammaker.com |
Safety warnings
- An inaccurate single-line diagram used as the basis for arc flash hazard analysis (NFPA 70E, IEEE 1584) will produce incorrect incident energy values and arc flash boundary distances. Electricians relying on incorrectly labelled panels may be exposed to incident energy levels exceeding their PPE rating — a potentially fatal hazard. All SLD updates must trigger a re-evaluation of arc flash hazard labels.
- Relay coordination studies based on the SLD determine which protective device clears a fault first. An error in the SLD — wrong transformer impedance, missing fuse in a feeder — can result in a coordination failure where an upstream breaker trips before the downstream fuse, causing a wider outage and potentially allowing fault current to flow for longer, increasing arc flash energy and equipment damage.
- Single-line diagrams for facilities with ungrounded (IT) or high-resistance grounded (HRG) systems must clearly indicate the grounding configuration of every transformer. Failure to correctly identify an ungrounded system can lead to a technician connecting test equipment in a way that creates a path for ground fault current, causing a shock hazard or equipment damage.
- Never perform switching operations (opening or closing circuit breakers or disconnects) on a power distribution system without verifying the current SLD. Switching a tie breaker closed when the SLD shows it should be open may parallel two transformers with incompatible impedances or phase angles, causing a fault that the protective devices may not clear selectively.
Tools needed
- circuitdiagrammaker.com — free browser-based editor with IEEE and IEC SLD symbols (bus bars, circuit breakers, transformers, CTs, PTs, disconnects) plus full schematic symbol libraries; PNG/SVG/PDF export; no download required
- ETAP or SKM PowerTools — professional power system analysis software that uses the SLD as the data model for load flow, short-circuit, arc flash, and relay coordination studies; industry standard for facilities and utility projects
- AutoCAD Electrical — CAD tool for producing SLDs and schematics with cross-reference automation and terminal-block schedule generation; widely used in industrial panel shops
- EPLAN Electric P8 — professional electrical CAD tool with integrated SLD, schematic, and wiring diagram capabilities; strong in European and international industrial projects
- IEEE 1584 arc flash calculation spreadsheet or NFPA 70E arc flash PPE category tables — for performing arc flash hazard analysis once the SLD data is confirmed accurate
- Relay time-current characteristic curves (from manufacturers: ABB, Schneider Electric, Eaton, Siemens) — for verifying protective device coordination using the SLD topology as the reference
Common mistakes
- Omitting current transformer (CT) and potential transformer (PT) locations from the SLD, making it impossible to perform arc flash or relay coordination studies without additional field investigation.
- Using an outdated SLD for arc flash analysis after switchgear has been modified — the resulting arc flash labels will underestimate incident energy at modified buses, which is a direct worker safety hazard.
- Drawing the schematic before the SLD is finalised, resulting in control circuits that reference equipment tags which are later renumbered on the SLD, creating cross-reference mismatches throughout the documentation set.
- Confusing the 'one-line diagram' term with a simplified single-phase diagram — a one-line diagram represents a three-phase system as one line; it is not a diagram of a single-phase circuit.
- Failing to show transformer winding configurations (delta vs wye, grounded vs ungrounded) on the SLD — this information is critical for ground fault protection design and is a frequent omission in documentation produced by non-power engineers.
- Presenting the SLD as the complete documentation for a control panel — the SLD shows what equipment is present; the schematic shows how it is controlled; the wiring diagram shows how it is wired. All three are required.
Troubleshooting
- Arc flash incident energy calculation produces unexpectedly high values at a bus
- Cause: The SLD shows an upstream transformer with higher kVA rating or lower impedance than actually installed, producing an over-estimated fault current. Alternatively, a protective device trip setting was changed in the field without updating the SLD. Fix: Field-verify transformer nameplate data (kVA, impedance percentage) and all protective device trip settings against the current SLD. Update the SLD with verified values and re-run the arc flash study. Re-label all affected panels before allowing workers to perform energised electrical work.
- Relay coordination study shows upstream breaker trips before downstream fuse for a fault near the fuse
- Cause: The SLD shows incorrect cable impedance between the breaker and fuse, underestimating the fault current available at the fuse location. Or the breaker trip curve was set more sensitively than documented. Fix: Measure cable resistance and reactance for the suspect feeder (or calculate from cable datasheet values and measured length). Input corrected values into the coordination study. If necessary, adjust the upstream breaker instantaneous trip setting to restore selectivity, and document the new setting on the SLD relay setting sheet.
- Control circuit schematic references a motor contactor tag (K1) that does not appear on the SLD
- Cause: The contactor was part of a panel-internal control circuit for a small motor or auxiliary function that was never added to the SLD, or the equipment tag was changed on the SLD after the schematic was issued. Fix: Determine whether the device belongs on the SLD (any power circuit device fed from the distribution system should appear). If it should appear, add it to the SLD with the correct tag and rating. Update the cross-reference index to reconcile all document tags.
- SLD shows a bus tie breaker in the normally open position, but field inspection finds it closed
- Cause: The plant operations team closed the bus tie for redundancy during a maintenance event and did not update the SLD or notify the engineering team. The SLD now represents a different system topology from the actual installation. Fix: Immediately update the SLD to reflect the as-operated configuration. Re-run arc flash and relay coordination studies for the new topology — paralleling two sources through a closed bus tie changes fault current levels and coordination. Issue revised arc flash labels before the next energised work activity.
- Schematic shows a control relay coil powered from 120 V AC, but field measurement finds only 12 V DC at the control transformer output
- Cause: The SLD and schematic were drawn for the planned design but the control transformer was substituted during procurement for a lower-voltage model, and neither document was updated. Fix: Verify the actual control transformer output voltage and verify that all relay and pilot light ratings are compatible with that voltage. Update both the SLD (if the control transformer appears as a labeled element) and the schematic (voltage rail annotations, component specifications). Check that all control circuit devices have the correct voltage rating for the installed transformer.
Frequently asked questions
What is the difference between a single-line diagram and a schematic diagram?
A single-line diagram (SLD) shows the high-level topology of a power distribution system — generators, transformers, buses, and circuit breakers — with three-phase connections condensed to a single line. A schematic diagram shows the detailed control circuit logic — relay contacts, coils, timers, and pilot lights — that operates the equipment shown on the SLD. Both documents are required for a complete industrial or power project documentation package.
Why is a three-phase system shown as a single line in an SLD?
In a balanced three-phase system, all three phases carry the same current magnitude and are identical except for phase angle. Drawing all three lines would triple the drawing complexity without adding engineering information. The single-line convention, standardised by IEEE 315 and ANSI Y32.9, allows power engineers to show the entire distribution topology on a compact, readable document. Three-phase circuit details are captured in separate equipment schematics and wiring diagrams.
Is a one-line diagram the same as a single-line diagram?
Yes. 'One-line diagram' is the US term and 'single-line diagram' (SLD) is the international (IEC) term for the same document type. Both terms appear in IEEE publications, NFPA codes, and utility standards. The abbreviation SLD is internationally recognised and is preferred in IEC-aligned projects.
When is a single-line diagram required by code (NEC/NFPA 70)?
NFPA 70 (NEC) requires available documentation showing the service entrance configuration for commercial and industrial facilities. Specific requirements appear in NEC Articles 230 and 240 and in NFPA 70E, which mandates that arc flash hazard analysis — which requires an accurate SLD — be performed and the results posted on electrical equipment. In practice, any professionally operated commercial or industrial facility should have a current SLD on file.
What is the difference between a single-line diagram and a wiring diagram?
An SLD shows the power system topology at the system level using the three-to-one-line simplification. A wiring diagram shows physical wire connections, terminal numbers, and wire colours at the component level. They are three levels apart in the documentation hierarchy: SLD (system) → schematic (control logic) → wiring diagram (installation detail).
Which diagram is used for arc flash analysis?
Arc flash analysis per IEEE 1584 requires the single-line diagram as its primary input. The SLD provides the short-circuit source impedances, transformer ratings, cable impedances, and protective device types and settings needed to calculate incident energy and arc flash boundary at every bus. An inaccurate or outdated SLD produces incorrect arc flash labels, which is a serious life-safety deficiency.
Can I use a schematic to replace a single-line diagram?
No. A schematic shows control circuit detail, not power system topology. It does not show transformer kVA ratings, bus voltage levels, circuit breaker interrupt ratings, cable sizes, or the protective device coordination hierarchy needed for arc flash or relay coordination studies. The SLD and schematic serve different engineering disciplines and neither can substitute for the other.
What software is used to draw single-line diagrams?
For power system analysis: ETAP and SKM PowerTools are the industry standards — they produce SLDs that also serve as the model for load flow, short-circuit, and arc flash calculations. For documentation-only SLDs: AutoCAD Electrical, EPLAN, SEE Electrical, and circuitdiagrammaker.com (free, browser-based, includes IEEE and IEC SLD symbols, bus bars, and circuit breakers).